
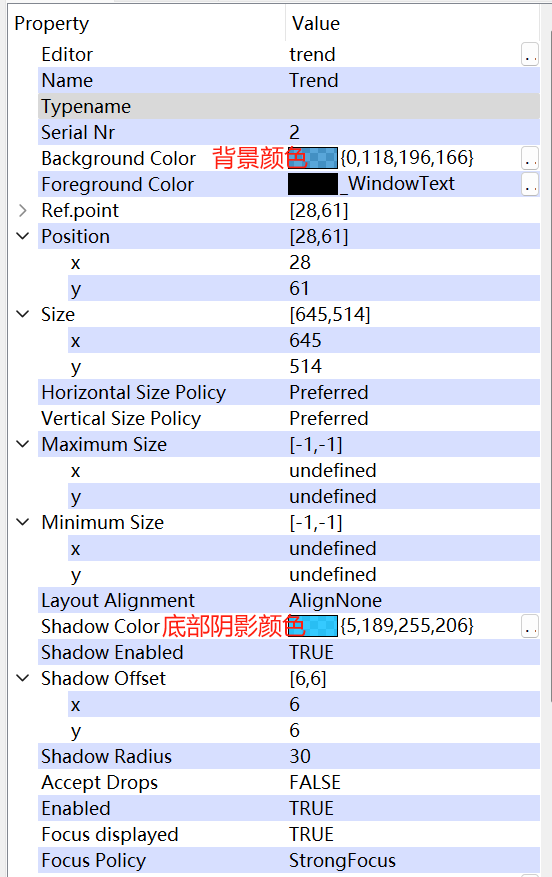
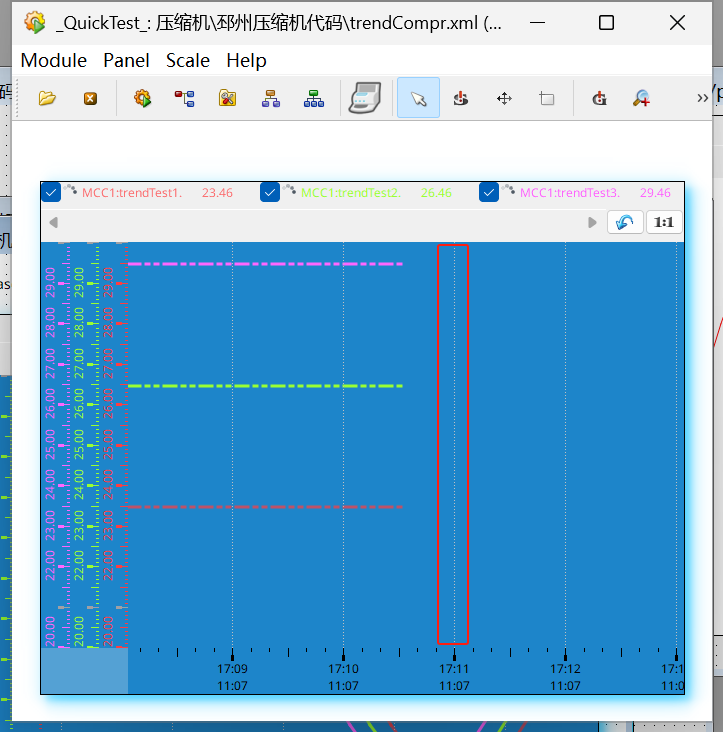
viewstar 折线图
界面配置
这里介绍的折线图为【value over time】,更多详细配置可在viewstar参考手册中搜索:Trend widget
Common—基础设置
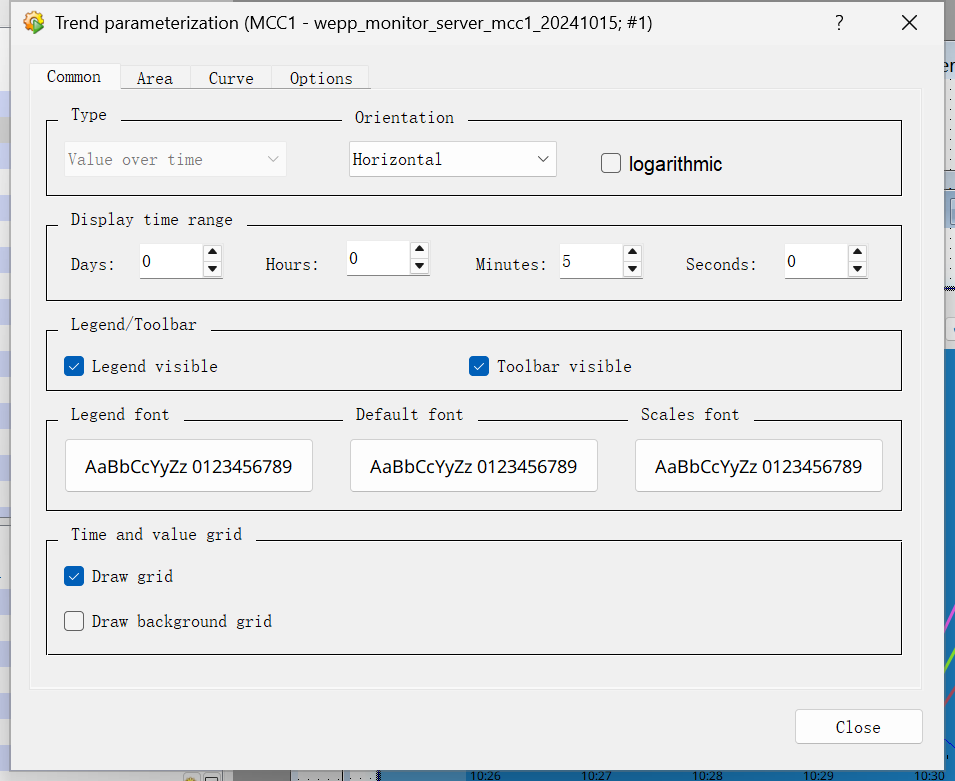
Display time range
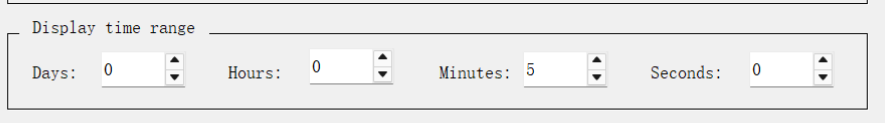
设置每一大格的时间间距
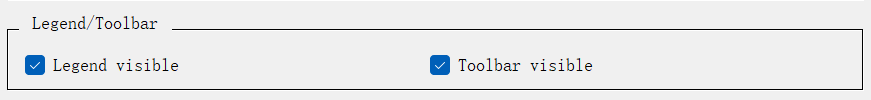
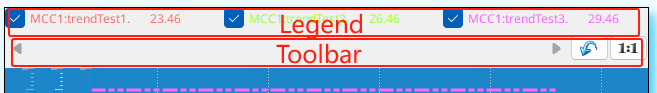
Legend/Toolbar
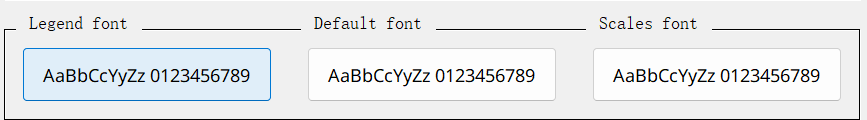
font
设置字体格式
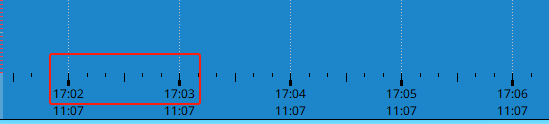
Time and value grid
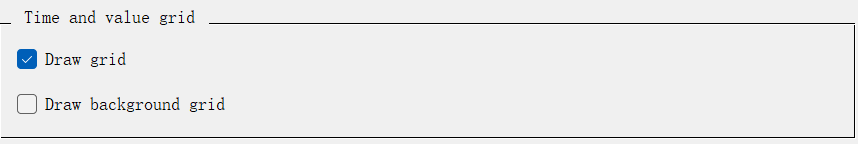
- Draw grid:会在每一个时间段出现一条虚线
- Draw background grid:意义不明
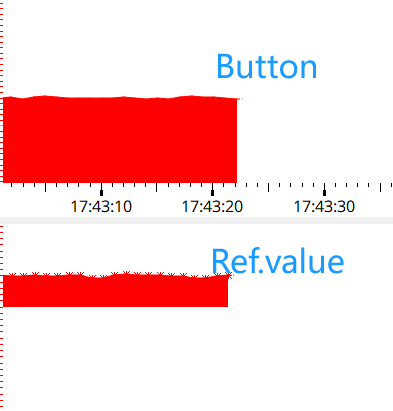
Area
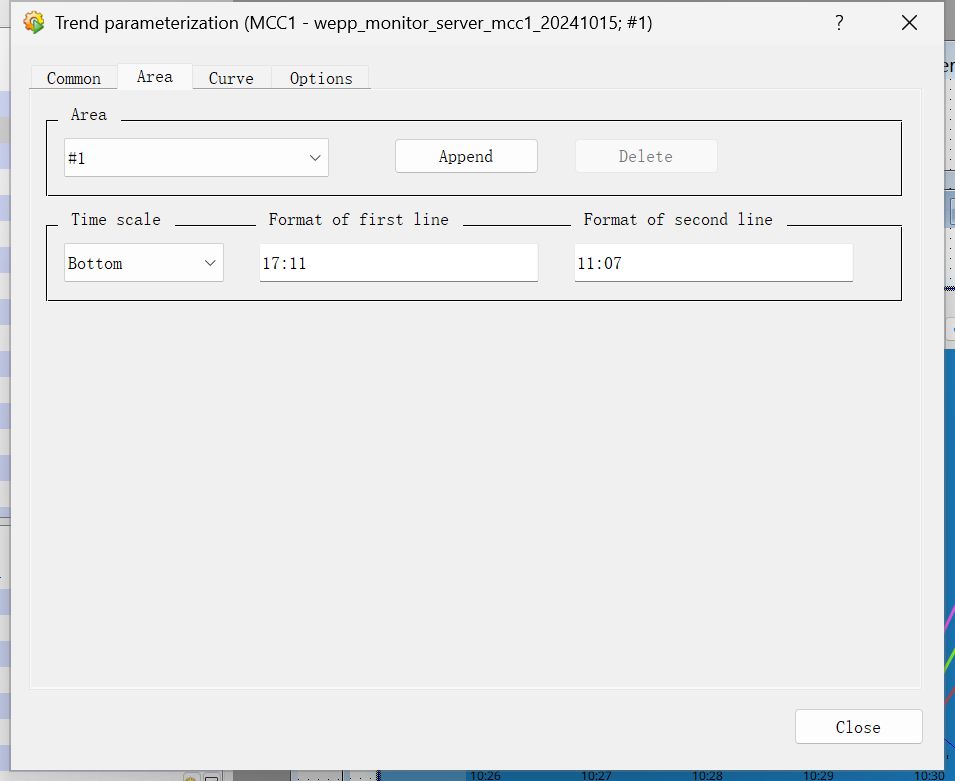
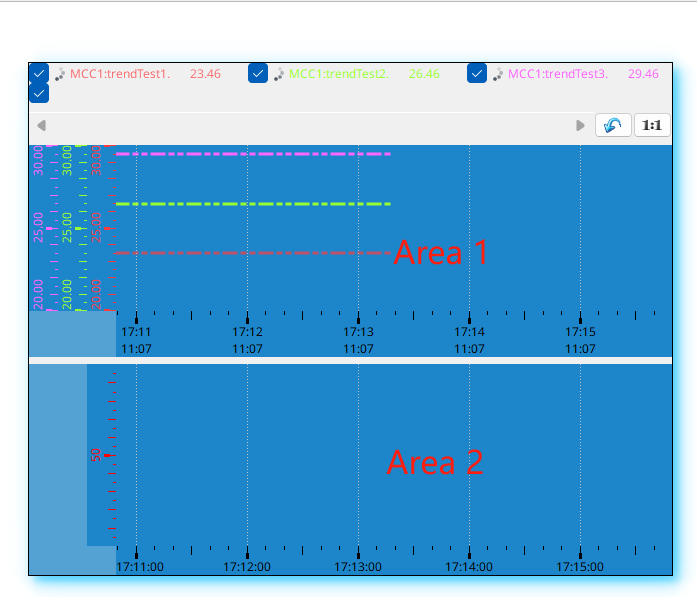
Area
一般只需要一个即可,如果是两个,效果如下
Time Scale
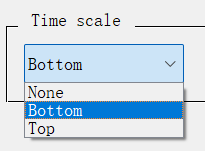
时间轴显示在下方还是上方
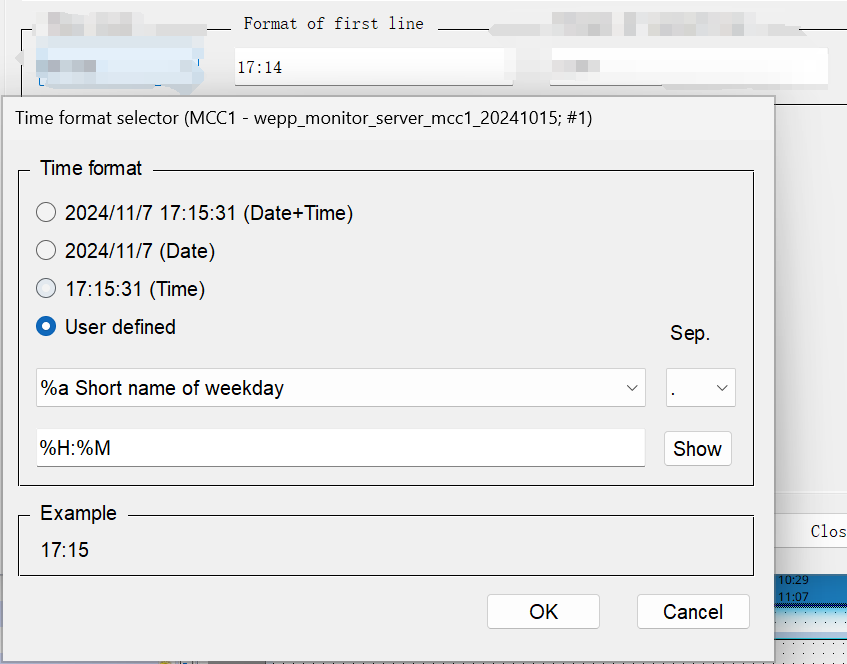
设置第一个显示时间,一般为【时:分】。通过User defined自定义设置
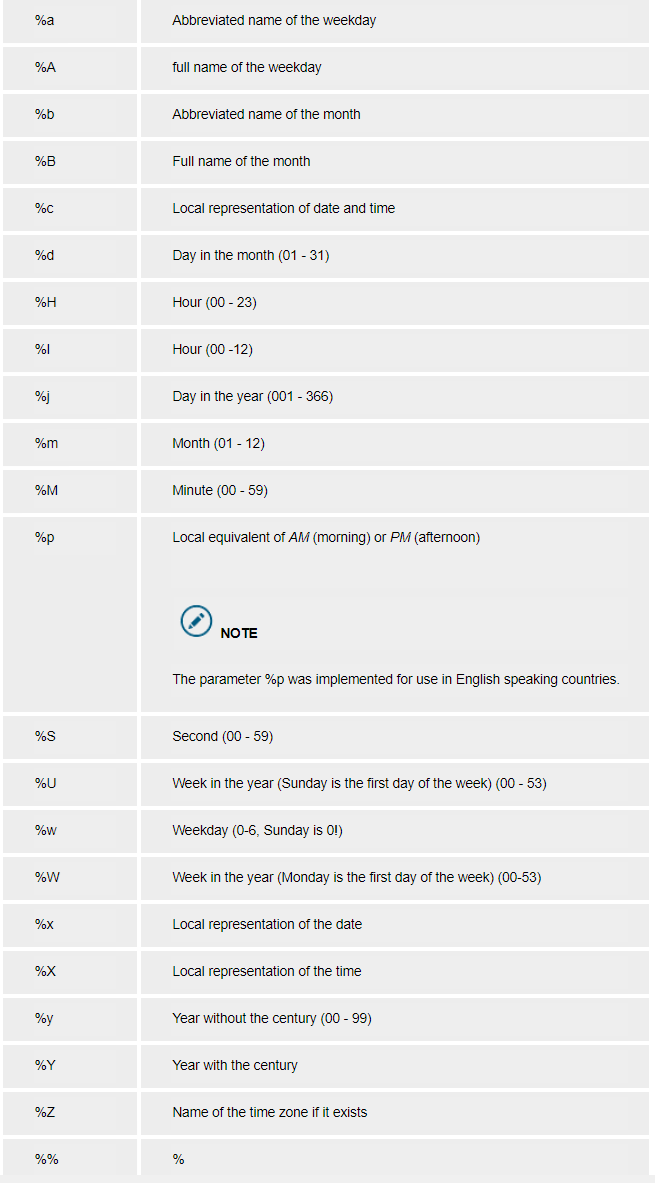
里面的参数可以通过viewstar的帮助手册搜索:formatTime。
内容如下:
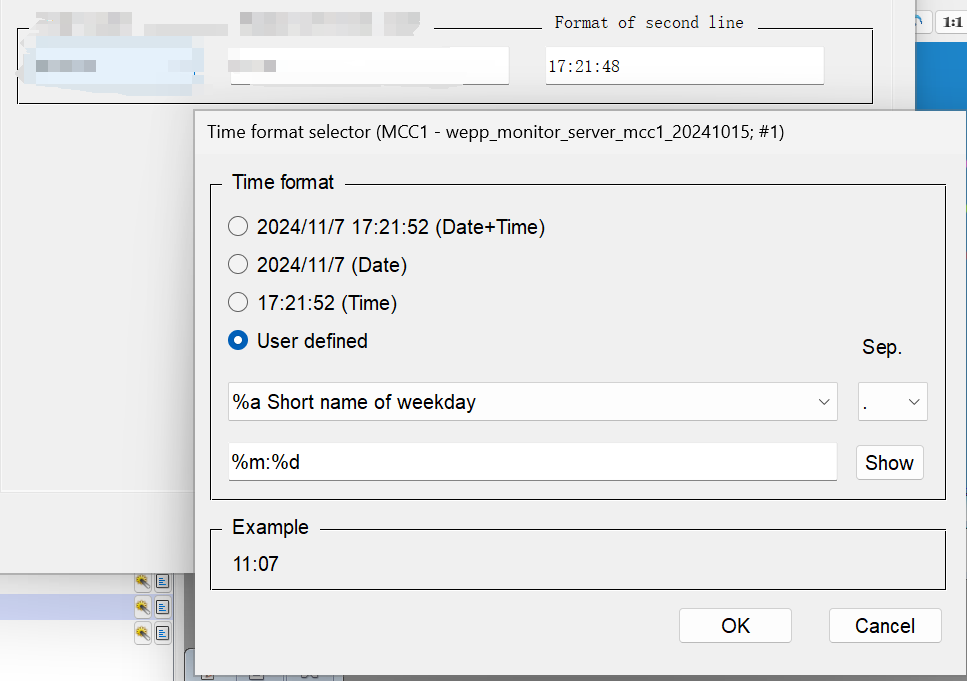
设置第一个显示时间,一般为【月:天】,设置方法同上。
Curve
添加曲线
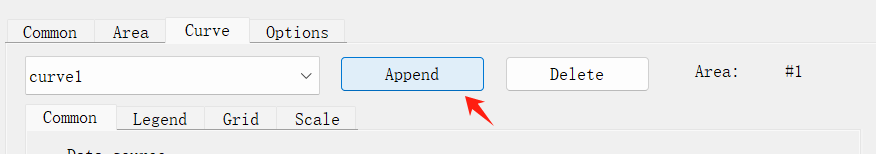
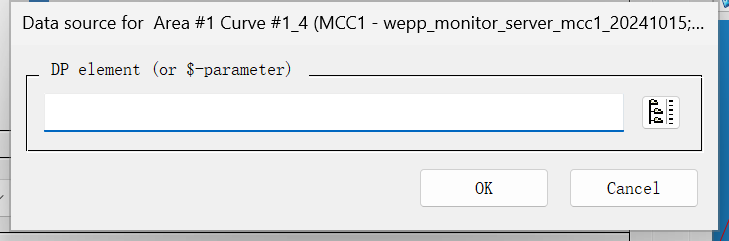
当点击添加曲线后,可以输入一个DP element。曲线就会随着这个DP值的变化而改变。(也可以不输入,在初始化中使用脚本添加)
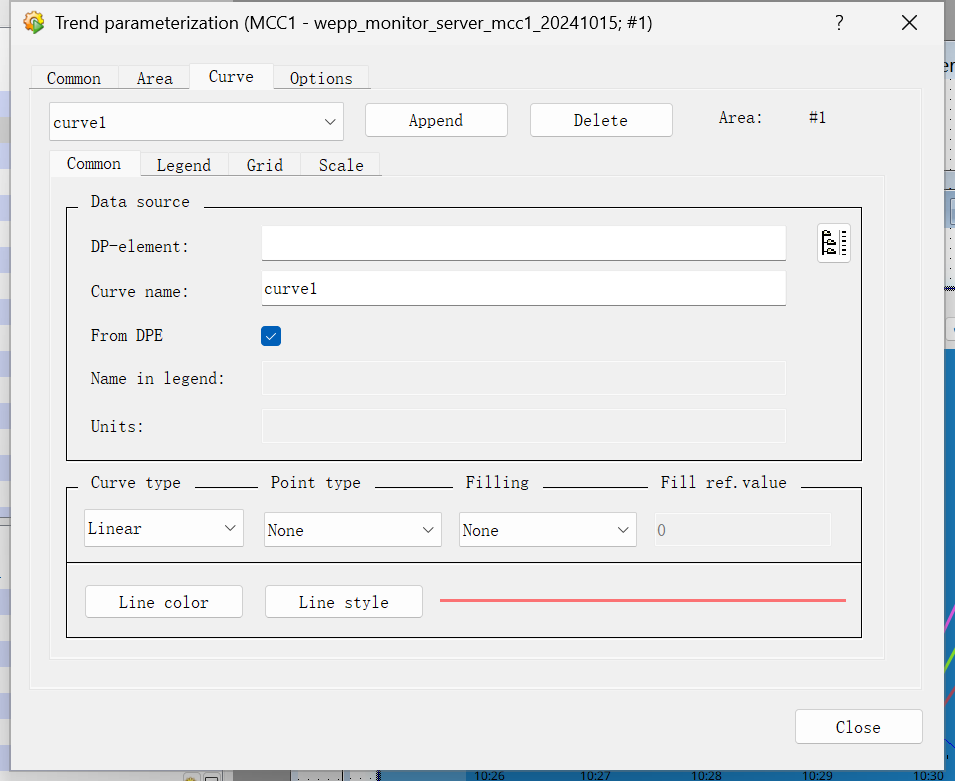
Common
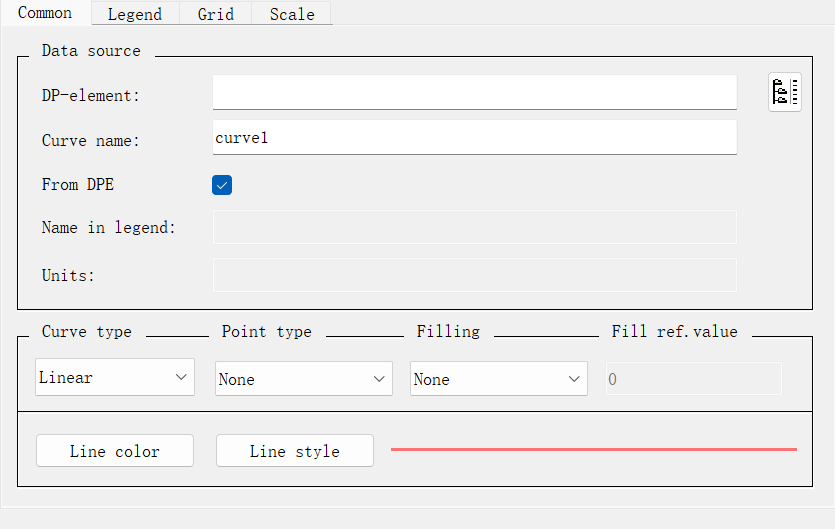
Data source
DP-element:检测的数据点名Curve name:曲线名称From DPE:默认勾选上
type
-
Curve type-
Points
-
Steps
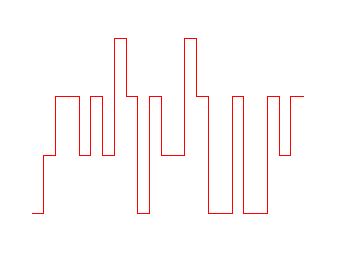
-
Linear
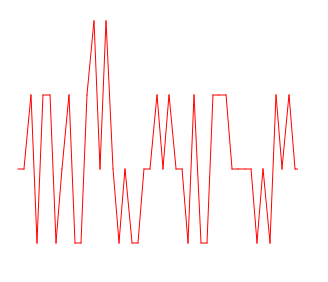
-
Event(感觉用不到)
-
-
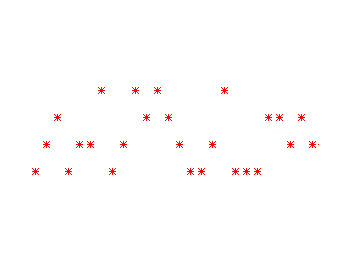
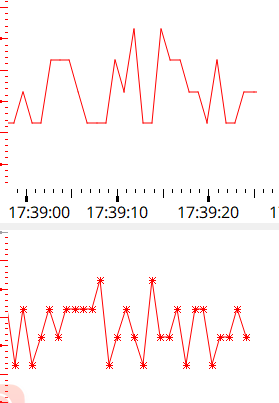
Point type
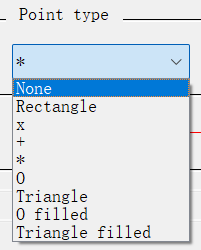
当数据点改变的形状。
如:
-
Filling- None
- Bottom
- Ref.value
- 对比:
-
Line color、Line style
设置曲线颜色,样式
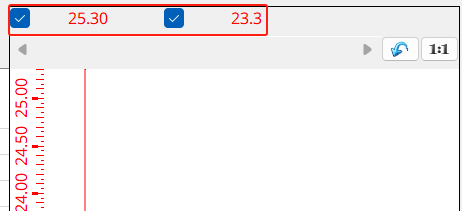
Legend

Value visible:显示顶部数据
勾选情况下:
Auto format x:
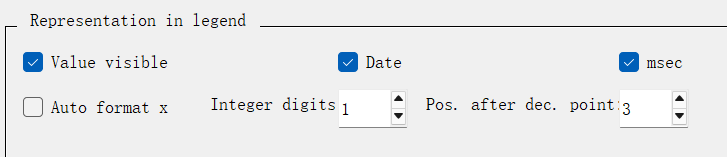
若这样设置,(第一个数字意义不明)第二个数字3表示,小数点保留三位。
Grid
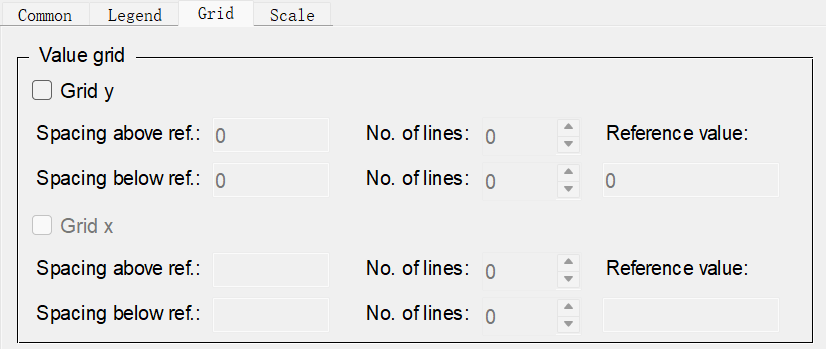
感觉没啥用,可以看看手册。
Scale
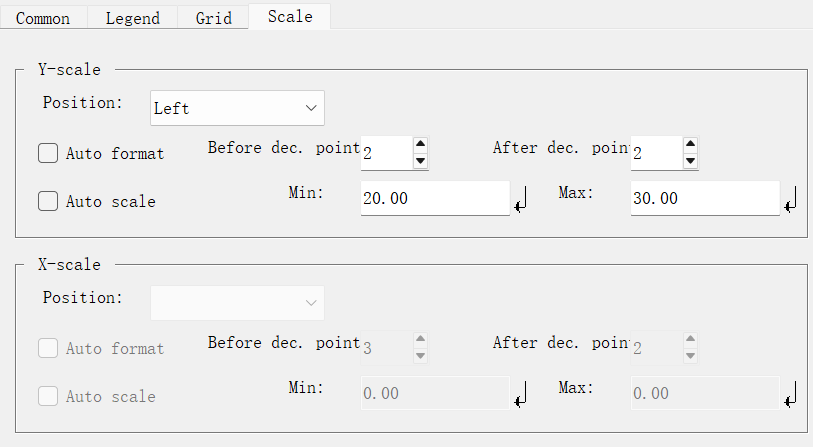
Y-scale
Auto format:Y轴上的数保留几位小数Auto scale:Y轴上的数最小显示多少、最大显示多少(设置这个可以防止Y轴乱跳)
Options
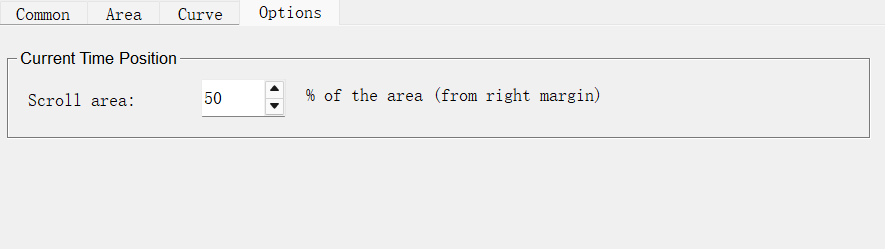
折现从哪个地方开始绘制
代码配置
更多详细配置可在viewstar参考手册中搜索:Trend
曲线添加数据点
connectDirectly
1 | shape.connectDirectly(string Name, string dp); |
运行曲线
trendRun
1 | shape.trendRun(); |
修改Legend字体
legendFont
连接曲线
linkCurves
1 | Trend.linkCurves("curve1", "curve2", "curve3"); |
修改Legend文字
curveLegendName
1 | Trend.legendFont("Arial Black, -1, 11, 5, 87, 0, 0, 0, 0, 0"); |
“Arial Black”:字体名称。这里设置为 “Arial Black”,即粗体的 Arial 字体。
-1:字符集(charset),通常 -1 表示使用系统默认字符集。
11:字体大小。这里指定字体大小为 11 点。
5:字体的粗细(weight)。5 表示中等粗细。不同值通常表示:
0表示常规(Regular)5表示半粗体(Medium)9表示粗体(Bold)
87:字体角度(angle),指定字体的倾斜角度。通常 0 表示正常,不倾斜。
0,0,0,0,0:这五个值一般用于指定额外的样式属性,通常在默认设置中都为 0,表示没有其他特殊效果。
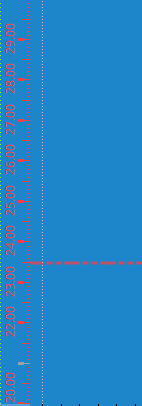
设置Y轴曲线的自动缩放
trendSetYaxisIndex
隐藏左侧Y轴曲线
curveScaleVisibility
设置左侧Y轴曲线格式
scaleFont
隐藏Y轴曲线
linkCurves
配合着curveScaleVisibility可以实现左边只有一条轴
如果有3条及以上的曲线,linkCurves连接时
1 | // 隐藏掉2、3条曲线的Y轴 |